GDBugging 101
A tutorial on mastering GDB's basic and advanced features for effective debugging.

Preface
Do you remember your early days of programming, when an off-by-one error could take half an hour to track down and fix? As we advance in our programming journey, one of the most valuable skills we develop is debugging.
Some bugs are easy to spot just by reading the code. Others require running the program to observe its behavior and pinpoint the issue. Then there are those elusive bugs that seem to occur randomly, leaving us clueless about their cause or timing.
For these more complex situations, we need more powerful tools. The GNU Project Debugger (GDB) is one such tool, offering a robust set of features to help developers diagnose and fix even the most challenging bugs.
Understanding GDB’s capabilities can help you choose the best approach for debugging complex problems, saving you both time and frustration. Even if you don’t use GDB regularly at work, its features can inspire techniques to improve your efficiency with other debuggers, like the Visual Studio Debugger.
Another reason to learn GDB is its command-line interface. It’s especially useful in environments where you don’t have access to a full-featured IDE.
About GDBugging 101
This tutorial aims to teach you how to perform all the debugging tasks you’re used to in your IDE’s debugger, but using GDB. It will also introduce tools that are not available in most IDEs or are not accessible through their interfaces. This tutorial is focused on debugging C/C++ programs, but GDB can also be used to debug programs written in many other languages.
This is not a comprehensive GDB manual. We won’t be covering advanced topics such as extending GDB with its Python API or other material intended for IDE developers. For detailed information on every command, option, language that GDB supports, and all its interfaces, refer to the book Debugging with GDB by Richard Stallman, Roland Pesch, Stan Shebs, and many other open-source contributors. This book goes in-depth on all those topics and can be a valuable resource for further learning.
In this tutorial, I will introduce you to the most essential tools that will help you improve your debugging skills in a reasonable amount of time.
GDBugging 101 Structure
This tutorial is a step-by-step guide to GDB which combines two approaches to the topic. In our first approach we start with tools for examining source code, then progress to techniques for controlling program execution (such as setting breakpoints and stepping through code), and finally, learn how to manage debugging sessions and customize the GDB environment.
In our second approach to the topic, we’ll start by introducing inferiors (the programs being debugged in a GDB session—yes, you can debug multiple programs at once), and cover how to switch between them. We’ll also explore how to control threads within each program, both independently and in relation to one another. Additionally, we’ll look at investigating stack frames, examining program variables, and ultimately delving into the raw memory (the zeros and ones).
The first approach delves into the granular details of your source code, gradually building up to the broader context of the entire debugging session. The second approach starts with high-level program constructs like threads and stack frames, and then dives deeper into the underlying machine code and memory representation.
Everything you need is included here. Just set aside a few days after work to go through the instructions and experiment on your own. This tutorial assumes you’re using a recent version of Ubuntu, but the commands should work seamlessly on other platforms as well.
For the impatient, let me start by walking you through a sample debugging session.
A Sample Run
Let’s debug Git! To do so we need to have Git and GDB installed.
1
2
3
sudo apt-get install git gdb
git --version
# git version 2.43.0
The version of your Git installation will become important when we want to fetch the source code for Git. Now let’s run Git under GDB:
1
2
3
4
5
6
7
8
9
gdb git
# ...
# For help, type "help".
# Type "apropos word" to search for commands related to "word"...
# Reading symbols from git...
#
# This GDB supports auto-downloading debuginfo from the following URLs:
#   <https://debuginfod.ubuntu.com>
Enable debuginfod for this session? (y or [n])
Choose y to enable debuginfod. The installed version of Git lacks debugging information, such as variable and function names (symbols). With debuginfod, this information can be fetched automatically. It enables us to map machine instructions in the executable back to the original source code. Alternatively, you could build the Git executable yourself, including debugging information, but using debuginfod is a faster and more convenient option.
If
debuginfodfails to find debug symbols for Git, you’ll need to build Git with debug symbols manually. Follow the Build from Source section of my Git tutorial, making sure to enable debug mode during the build. If you do this, thegdbcommands that start withsubstitute-pathwill not be necessary.
The gdb git command does not start the executable automatically. To start the debugging from the first instruction use GDB’s start command:
1
2
3
4
5
(gdb) start
# ...
# Temporary breakpoint 1, main (argc=1, argv=0xffffffffeef8)
#     at /usr/src/git-1:2.43.0-1ubuntu7.1/common-main.c:32
# warning: 32     /usr/src/git-1:2.43.0-1ubuntu7.1/common-main.c: No such file or directory
Notice the line containing No such file or directory. This error occurs because we don’t yet have the source code for Git. To fetch the exact source code corresponding to your Git version, open another terminal and run the following command (replace 2.43.0 with your version):
1
2
3
4
git clone --depth 1 --branch v2.43.0 https://git.kernel.org/pub/scm/git/git.git
cd git
pwd
# /home/mohammad/git
Next, we need to inform GDB where to find the source code. In your GDB session, run the following command:
1
2
3
# Run external command using !<cmd>
(gdb) !clear
(gdb) set substitute-path /usr/src/git-1:2.43.0-1ubuntu7.1 /home/mohammad/git
The substitute-path setting in GDB takes two parameters. Whenever GDB looks for a path that starts with the first parameter, it substitutes it with the second.
Now, you can start experimenting with GDB:
- Use
list .(orl .for short) to view the next portion of code to be executed. - Use
list(orlfor short) to display more of the source code. - Use
next(ornfor short) to execute the next source line. - Use
step(orsfor short) to step into a function. - Use
finishto step out of the current function. - Use
continue(orcfor short) to let the program run freely. - Use
backtrace(orbtfor short) to view the current stack frames. - Use
quit(orqfor short) to exit GDB.
Let’s start a new debugging session in our newly fetched Git repository and this time by providing some arguments to the Git command:
1
2
3
4
5
gdb --args git status

(gdb) pwd
# Working directory /home/mohammad/git.
(gdb) set substitute-path /usr/src/git-1:2.43.0-1ubuntu7.1 /home/mohammad/git
Before running the program, let’s set a breakpoint and then execute the program:
1
2
(gdb) break cmd_status
(gdb) run
Unlike the start command, run executes the program until it hits a breakpoint.
Using the commands introduced so far, you can explore and understand the Git source code in great detail. This approach is applicable to other open-source applications too.
Source Files
GDB can easily locate the source code when the program is built from source, as the source path is embedded in the debugging information. You can use the list command (l for short) to view the source code. In GDB, you may encounter the term locspec, short for Location Specification. It refers to a specific point in your source or machine code. Many GDB commands accept a locspec argument, which can be provided in various formats, including linenum, filename:linenum, function, or filename:function.
Continuing with our Git example, follow these steps to properly set up our GDB session:
1
2
3
4
5
6
7
8
9
10
11
pwd
# /home/mohammad/git
git pull --depth=2

# Set the EDITOR environment variable then run GDB
EDITOR=nano gdb --args git show

# In the GDB command line
(gdb) set substitute-path /usr/src/git-1:2.43.0-1ubuntu7.1 /home/mohammad/git
(gdb) break cmd_show
# Breakpoint 1 at 0x94680: file builtin/log.c, line 734.
Now, let’s use list to investigate the code. Just as we set a breakpoint using function names, we can view the code inside a function:
1
(gdb) list cmd_show
For certain commands, pressing the return key re-executes the previous command. With list, this allows you to repeatedly display the next portion of code, continuing from the last displayed position. You can change the direction of consecutive list executions using list - to move backward and list + to move forward through the code.
To view the next execution point, use the command list . (or l . for short). In our example, since the Git program hasn’t been run inside GDB yet, the command will display a function that executes before main. While debugging, you’ll often use list . to view the surrounding code at a breakpoint.
The list command can be used not only to view functions but also to display entire files:
1
2
3
4
(gdb) show listsize
(gdb) set listsize unlimited
(gdb) set pagination off
(gdb) list diff.h:0
However, if you want to examine the entire file, opening it in an editor might be more practical. Recall that we set the EDITOR environment variable earlier. You can use the edit command as follows:
1
2
3
4
5
# Function name
(gdb) edit cmd_show

# Source line
(gdb) edit diff.c:0
In some cases, ambiguity can prevent GDB from displaying the file. Even specifying the full path may not resolve the issue:
1
(gdb) edit /usr/src/git-1:2.43.0-1ubuntu7.1/diff.c:0
For functions or file names containing irregular characters, you need to use explicit location arguments:
1
(gdb) edit -source /usr/src/git-1:2.43.0-1ubuntu7.1/diff.c -line 0
GDB offers a convenient way to search through the current source file using regular expressions:
1
2
3
4
5
# Search forward for the specified pattern
(gdb) forward-search <regexp>

# Search backward for the specified pattern
(gdb) reverse-search <regexp>
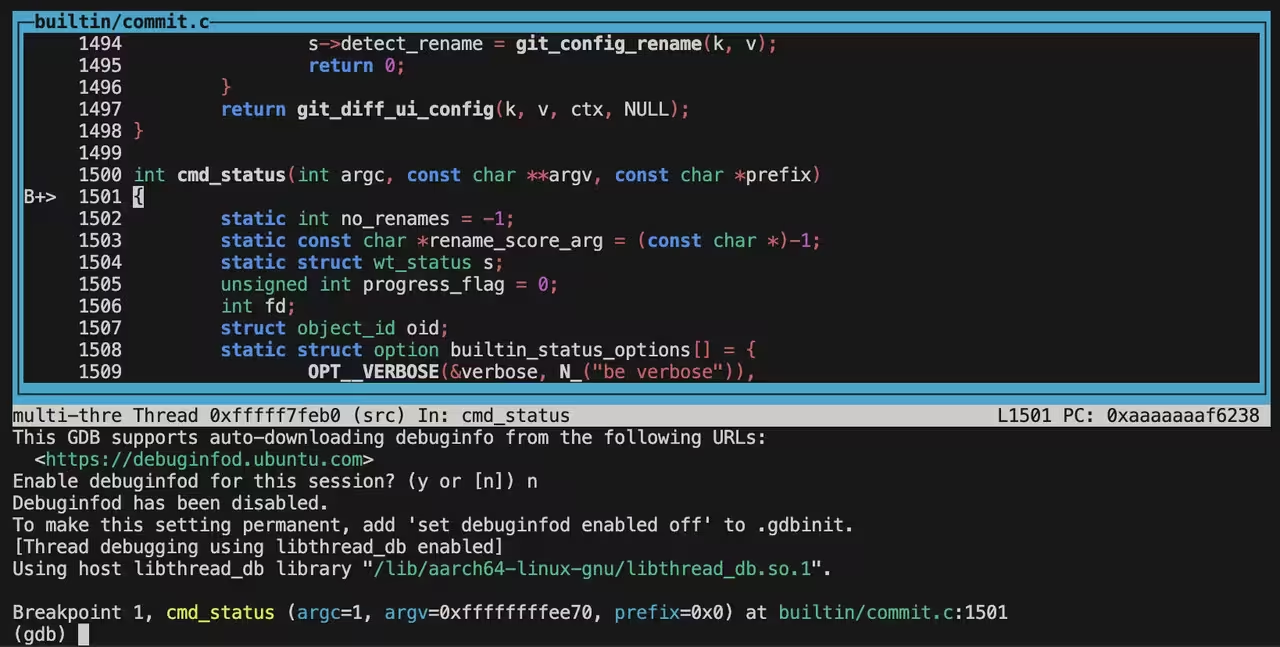
You can toggle GDB’s TUI (Text User Interface) mode using the key combination Ctrl+X, Ctrl+A. TUI mode comes with its own set of shortcuts, which you can learn more about here. The following shows the TUI view when execution reaches our breakpoint at
cmd_show:
Breakpoints
We briefly introduced breakpoints in the A Sample Run section. Here, we’ll delve deeper into the various ways to set and manage breakpoints, as well as explore other types of breakpoints designed for specific scenarios.
Use the following commands to manage breakpoints in GDB:
1
2
3
4
5
6
7
8
9
10
11
12
13
14
15
16
# Break on a locspec
(gdb) break <locspec>

# Display a list of all breakpoints, watchpoints, and catchpoints
(gdb) info breakpoints

# Remove all breakpoints or specific ones by their IDs
(gdb) delete
(gdb) delete <id>

# Delete any breakpoints at locspec
(gdb) clear <locspec>

# Enable or disable specific breakpoints by their IDs
(gdb) enable <id>
(gdb) disable <id>
By using the ignore option on a breakpoint, GDB can skip the next few times the breakpoint is hit.
1
2
3
4
5
# List all breakpoints and their IDs
(gdb) info breakpoints

# Ignore the next n hits of a breakpoint
(gdb) ignore <id> <n>
This feature is particularly useful when, for example, you are processing elements of a list and calling a function for each element, but you’re only interested in a specific one. You can set a breakpoint at the function call and use the ignore option to skip the first <n> elements, stopping only when the desired element is processed.
You can create a conditional breakpoint in GDB by specifying a condition in the break command:
1
2
3
4
5
6
7
8
# Create a conditional breakpoint
(gdb) break <locspec> if <expression>

# Add or modify the condition
(gdb) condition <id> <expression>

# Remove the condition
(gdb) condition <id>
With a conditional breakpoint, program execution will only stop at the specified locspec if the condition is met. This feature is particularly useful for isolating specific cases in loops or complex code paths.
GDB allows you to specify a list of commands to execute automatically when a breakpoint is hit. For example, the following setup instructs GDB to silently print a variable, enable another breakpoint, and then continue execution whenever breakpoint <id> is hit:
1
2
3
4
5
6
(gdb) commands <id>
  silent
  print <var>
  enable <id_2>
  continue
end
Alternatively, you can use the commands list to reset the ignore count, effectively creating a breakpoint that only triggers on every n-th hit:
1
2
3
(gdb) commands <id>
  ignore <id> <n>
end
To remove the commands list associated with a breakpoint, set an empty commands list:
1
2
(gdb) commands <id>
end
By adding the thread option to the break command, you can set a breakpoint that applies only to a specific thread.
1
2
3
4
5
6
7
8
# List existing threads
(gdb) info threads

# Switch between threads
(gdb) thread <id>

# Set a breakpoint for a specific thread
(gdb) break <locspec> thread <id>
This feature is especially useful when debugging multi-threaded programs. For example, if you’re waiting for execution to reach a specific function but that function is also accessed by other threads, a thread-specific breakpoint ensures you stop only when the target thread reaches the function. This helps avoid unnecessary interruptions from other threads. The thread argument can be combined with other options, such as if for conditional breakpoints or ignore to skip a specified number of hits.
To save all the breakpoints, watchpoints, catchpoints, and their configurations (such as conditions, ignore counts, and command lists) in your current debugging session to a file, use the following command:
1
2
3
4
5
# Save
(gdb) save breakpoints <filename>

# Restore
(gdb) source <filename>
Watchpoints
In addition to breakpoints, you can set a watchpoint to monitor when a variable or memory address is accessed or modified.
1
2
3
4
5
6
7
8
# Break when a variable changes
(gdb) watch <var>

# Break when data at address changes
(gdb) watch -location *<address>

# Print list of all watchpoints
(gdb) info watchpoints
A read watchpoint is particularly useful when you want to track which parts of the code depend on a variable’s value. It allows you to identify and investigate those areas further.
1
2
3
4
5
# Break when address is accessed
(gdb) awatch -location *<address>

# Break when a variable is read
(gdb) rwatch <var>
Watchpoints are a special type of breakpoint. Any of the commands used for managing regular breakpoints, such as ignore, thread, or commands, also work for watchpoints.
Now let’s use the rwatch command to pinpoint when the git show command prints the commit hash. Here’s a step-by-step explanation:
Set Up the GDB Session: Start by setting up the GDB session as described in the Source Files section.
Locate the Color Structure: Through investigation, you’ll discover that the colors for various parts of the diff output are stored in a structure called
diff_colors. The array elementdiff_colors[6]corresponds to theCOMMITcolor.- Set the Watchpoint:
- First, run the program until the
cmd_showbreakpoint is hit:1
(gdb) run
- Then, set a watchpoint to monitor accesses to
diff_colors[6][0]:1
(gdb) rwatch diff_colors[6][0]
- First, run the program until the
- Continue Execution:
- Resume program execution and let it run until the watchpoint is triggered:
1
(gdb) continue
- Resume program execution and let it run until the watchpoint is triggered:
- Inspect the Call Stack:
- Move up two levels in the stack to identify the context in which the watchpoint was triggered (we will learn stack navigation in a later section):
1
(gdb) up 2
- Move up two levels in the stack to identify the context in which the watchpoint was triggered (we will learn stack navigation in a later section):
- View the Relevant Source Code:
- Use the
listcommand to examine the part of the code where the commit hash is printed:1
(gdb) list
- Use the
In my Git installation and source code for version 2.43.0, the line log-tree.c:746 is responsible for printing the commit hash in yellow color:
1
2
3
(gdb) up 2
#2 in show_log (opt=0xffffffffdc28) at /usr/src/git-1:2.43.0-1ubuntu7.1/log-tree.c:746
746   fputs(diff_get_color_opt(&opt->diffopt, DIFF_COMMIT), opt->diffopt.file);
Catchpoints
With GDB, you can set catchpoints to break on specific exceptions anywhere in your code. Here’s a summary of the different types:
1
2
3
4
5
6
7
8
# Break when an exception is thrown
(gdb) catch throw <exception>

# Break when an exception is rethrown
(gdb) catch rethrow <exception>

# Break when a catch block is executed
(gdb) catch catch <exception>
GDB also supports catchpoints for system calls:
1
2
3
4
5
6
7
8
grep "sleep"  /usr/include/asm-generic/unistd.h

# Break on a specific system call
(gdb) catch syscall sys_nanosleep
(gdb) catch syscall 101

# Break on any system call
(gdb) catch syscall
Catchpoints for system calls are particularly useful for monitoring your software’s interactions with the underlying system.
Execution Control
In the A Sample Run section, we saw that you can resume execution after hitting a breakpoint using continue, move to the next source line with next, step into a function with step, or step out of a function with finish.
The step and next commands accept a numerical argument, allowing you to specify the number of lines to skip before stopping. This can be useful for quickly advancing through sections of the code without stepping line-by-line.
Until
Additionally, there’s a command called until that can be very useful:
- When used at the end of a loop, it runs the loop until it finishes.
- In the context of a recursive function, it continues execution until all subsequent recursive calls are completed.
This makes until a handy tool for bypassing repetitive code structures, such as loops or recursive calls, without having to manually step through each iteration or recursion. It can also take a locspec argument, which instructs GDB to continue execution until the specified location is reached.
Return
You can give up the execution of the remaining instructions in a function and return early with a value of your choice using the return command in GDB. This is useful for bypassing problematic code or testing alternate scenarios.
1
2
# Give up execution and return a value
(gdb) return <return-value-expression>
Jump
You can also force execution to continue from another location in your program, bypassing the normal flow of control. Here’s how:
1
2
3
4
5
# Set a temporary breakpoint
(gdb) tbreak <locspec>

# Force execution to jump to a specific location
(gdb) jump <locspec>
The tbreak command sets a temporary breakpoint at the specified locspec. This breakpoint will trigger once and then automatically delete itself.
Skip
Imagine you’ve set a breakpoint inside a low-level function, and your debugging involves high-level functions that call this low-level function. Multiple high-level functions might invoke the low-level function, possibly in a loop. While stepping through the program or continuing execution, you may want to ignore the low-level breakpoint for all but one specific high-level function call.
In such cases, you can use skip to ignore functions based on their file or specific names:
1
2
3
4
5
# Skip all functions in a specific file
(gdb) skip file <file>

# Skip a function with a specific name
(gdb) skip function <function_name>
This allows you to focus on the function calls you care about while avoiding unnecessary interruptions from other calls. To manage skip settings in your current debugging session, use the following commands:
1
2
3
4
5
6
7
8
9
10
11
# View details of all skips
(gdb) info skip

# Enable a specific skip by its ID
(gdb) skip enable <id>

# Disable a specific skip by its ID
(gdb) skip disable <id>

# Remove a specific skip by its ID
(gdb) skip delete <id>
Stepi
For low-level debugging, to step through assembly instructions, you can use the stepi command. In later sections, we will explore how to display instructions memory. Here’s an example of how to properly use stepi in a GDB session:
1
2
3
4
5
6
7
8
9
10
11
# Start GDB
gdb <executable>

# Begin the debugging session
(gdb) start

# Display 16 instructions after the program counter (PC)
(gdb) display /16i $pc

# Step through the next instruction
(gdb) stepi
Reverse Execution
GDB provides the ability to execute your program in reverse, allowing you to undo the effects of the current source line or instruction. This feature is invaluable for investigating the state of the program just before a particular change occurred. Here are the commands to move backward:
1
2
3
4
5
6
7
8
9
10
11
12
13
14
15
# Move to the previous instruction
(gdb) reverse-stepi

# Move to the previous instruction or
# step out to the outer stack frame in reverse
(gdb) reverse-step

# Move to the previous source line
(gdb) reverse-next

# Continue execution in reverse until the previous breakpoint
(gdb) reverse-continue

# Move back to where the current function was called
(gdb) reverse-finish
Not every command’s effect can be reversed in GDB. For instance, when working with shared resources, other processes may modify the underlying resource, making it impossible to recreate the exact state. Similarly, operations involving external systems, like file I/O or network communication, may produce irreversible effects due to their dependence on factors outside the program’s control.
Sessions
The moment you run the GDB command, you begin your debugging session. There are a few settings associated with sessions, as well as techniques unrelated to the debugged program, that can significantly enhance your debugging experience. In this section, we’ll explore these aspects in detail.
Logging
It is possible to log all GDB commands and their responses into a file. To view the current logging configuration for your session, run the following command:
1
2
3
4
5
6
(gdb) show logging
# logging debugredirect:  off: Debug output will go to both the screen and the log file.
# logging enabled:  off: Logging is disabled.
# logging file:  The current logfile is "gdb.txt".
# logging overwrite:  off: Logging appends to the log file.
# logging redirect:  off: Output will go to both the screen and the log file.
To modify any of these settings, use the set logging command. Press the Tab key twice to see available options:
1
2
(gdb) set logging <tab><tab>
# debugredirect  enabled        file           overwrite      redirect
From there, you can adjust the logging configuration as needed.
Directories
In the A Sample Run section, we saw how to substitute the path GDB uses to locate source files with the path where they are actually stored. You can define multiple substitution rules and manage them using the following commands:
1
2
3
4
5
6
7
8
9
10
11
# To add substitution rule
(gdb) set substitute-path </from/dir> </to/dir>

# Display the current substitution rules
(gdb) show substitute-path

# Remove a specific substitution rule
(gdb) unset substitute-path </from/dir>

# Reset all substitution rules
(gdb) unset substitute-path
Another way to guide GDB to find relevant directories is by adding them to its search path instead of using substitution rules. This allows GDB to look for source files in the specified directories.
1
2
3
4
5
6
7
8
# Add directories to GDB's source search path
(gdb) directory <dir1> <dir2> ...

# Display the current source search path
(gdb) show directories

# Reset the source search path to its default value
(gdb) directory
Useful Settings
GDB can be extensively customized to fit different debugging needs. Some settings stand out due to their usefulness in making your debugging experience more efficient. One of these settings is listsize, which we encountered earlier in the Source Files section.
When you set a breakpoint on an overloaded function (a function with the same name but different parameters), GDB will set a breakpoint on all versions of that function by default. You can control this behavior using the following setting:
1
2
3
4
5
6
7
8
# Show the current value
(gdb) show multiple-symbols

# Ask when some expression is ambiguous
(gdb) set multiple-symbols ask

# Do nothing when some expression is ambiguous
(gdb) set multiple-symbols cancel
There are two additional settings in GDB that control the information displayed for each stack frame and upon function entry. We’ll discuss stack frames in more detail at Stack Frames. These settings allow you to fine-tune how GDB displays data during debugging.
1
2
3
4
5
6
7
8
# Control whether to show frame arguments
(gdb) set print frame-arguments <all|scalars|presence|none>

# Control what is printed when a function is entered
(gdb) set print entry-values <no|default|both|...>

# Control what information the `frame` command shows
(gdb) set print frame-info <auto|location-and-address|...>
There are several settings in GDB that control how the print command output is displayed. We will discuss the print command in detail in the Expressions section. These settings allow you to customize the format of the output, making it easier to interpret and work with different types of data during debugging.
1
2
3
4
5
6
7
8
9
10
11
12
13
14
15
16
17
18
19
20
21
22
23
24
25
26
27
28
29
30
31
32
# Enable pretty printing for arrays (improves readability)
(gdb) set print array on

# Show array indexes in the output
(gdb) set print array-indexes on

# Limit the number of array elements displayed
(gdb) set print elements <num>

# Limit the number of repeated elements shown for arrays
(gdb) set print repeats <num>

# Control the depth of nested structures printed (helps with deeply nested data)
(gdb) set print max-depth <num>

# Stop printing strings once a null character is encountered
(gdb) set print null-stop <on|off>

# Enable indentation for printed structures (makes output more readable)
(gdb) set print pretty <on|off>

# Print union members
(gdb) set print union <on|off>

# Display the actual derived type for polymorphic objects
(gdb) set print object <on|off>

# Display virtual function tables (v-tables) for C++ objects
(gdb) set print vtbl <on|off>

# Show bytes in nibbles (4 bits each) for detailed memory inspection
(gdb) set print nibbles on
Initialization Scripts
If you have a set of preferred settings that work well for your debugging workflows and want them to be applied automatically in every GDB session, you can add them to one of the configuration files that GDB reads during startup.
GDB searches for an initialization file in the home directory at the following locations:
$HOME/.config/gdb/gdbinit$HOME/.gdbinit
After loading the home directory initialization file (if it exists), GDB will also look for a local initialization file in the current directory, named .gdbinit.
Additionally, you can specify a custom initialization file when starting GDB using the following command:
1
gdb -init-command <file>
There are also system-wide and early initialization files, but we won’t delve into them here.
Core Dumps
A core dump captures the state of a program at the moment of a crash or during a hang. It can be created manually or configured to be automatically generated by the operating system when a program crashes. Core dumps provide a valuable opportunity to debug and fix issues that were not caught during development or occur only on the customer’s machine. They include the application’s memory and the execution state of each thread at the time the dump was created.
To attach to a process and create a core dump, follow these steps:
1
2
3
4
5
6
7
8
9
10
11
12
13
14
# List all running processes
ps -aux

# List processes for the current user
ps -u

# Attach to a process with a specific Process ID (PID)
gdb -p <pid>

# Generate a core dump to a default file named core.<pid>
(gdb) generate-core-file

# Generate a core dump to a custom file
(gdb) generate-core-file <filename>
You can also use the gcore command as a shortcut to generate a core dump.
If someone provides you with a core dump, you can start a GDB session using the dump file. From there, investigate the threads, their stack frames, and variables to diagnose the issue:
1
2
3
4
5
# Generate a core dump
(gdb) gcore <core-dump-file>

# Start a GDB session with the core dump
gdb <executable> <core-dump-file>
In a GDB session with a core dump, you cannot resume execution because the core dump represents a snapshot of the program’s state at a specific moment. It is not a running process.
Checkpoints
It’s common during debugging to carefully follow a precise execution path to recreate a faulty situation for investigation. However, mistakes happen—like accidentally stepping over a function that modifies critical data—forcing you to start over and recreate the conditions.
To address this, GDB provides checkpoints, allowing you to save the state of your program and debugging session. If something goes wrong, you can restore a checkpoint and continue from there:
1
2
3
4
5
6
7
8
9
10
11
# List all the checkpoints
(gdb) info checkpoints

# Create a checkpoint of the current state
(gdb) checkpoint

# Restore a checkpoint by its ID
(gdb) restart <checkpoint-id>

# Delete a checkpoint
(gdb) delete checkpoint <id>
This feature can save significant time and effort during complex debugging sessions.
Attaching Processes
So far, we have seen a couple of ways to start a GDB session. One method specifies only the executable, and another method includes providing an executable with some arguments:
1
2
3
4
5
# Start a GDB session with just the executable
gdb <executable>

# Start a GDB session with the executable and arguments
gdb --args <executable> <arg1> <arg2> ...
You can start GDB without specifying any process or executable initially. You can load the executable or attach to a running process later within the GDB session itself. Here’s how you can do that:
1
2
3
4
5
6
7
8
9
10
11
12
# Run GDB
gdb

# Set the executable
(gdb) file <executable>
# Set the arguments
(gdb) set args <arg1> <arg2> <...>
# Start debugging
(gdb) start

# Or attach to process
(gdb) attach <pid>
You can use the following commands to start GDB by attaching it to a running process:
1
2
3
4
5
6
7
8
# List all running processes
ps -aux

# Optionally, filter by user
ps -u <username>

# Attach GDB to the process
gdb -p <pid>
Once GDB is attached, it takes control of the process, allowing you to inspect its state, set breakpoints, step through the code, and analyze variables or threads.
If you have a program that pollutes the terminal with its output, you can run the application in a separate terminal and then attach GDB to it. This way, your debugging output won’t mix with the output from the application.
To conclude a GDB session, use the following commands as needed:
1
2
3
4
5
6
7
8
# Terminate the program being debugged
(gdb) kill

# Detach GDB from the program being debugged
(gdb) detach

# Exit the GDB session
(gdb) quit
These methods cover various ways to start a session with a single process. However, GDB also allows debugging multiple programs simultaneously within a single session. The next section will explore how to achieve this.
Inferiors
Programs that we run under GDB for debugging are referred to as inferiors. GDB can manage multiple inferiors within the same session. This capability is particularly useful when debugging setups like server-client architectures, where you can debug both programs simultaneously in a single session.
To manage inferiors in the current GDB session, you can use the following commands:
1
2
3
4
5
6
7
8
9
10
11
12
13
14
15
16
17
# List all inferiors
(gdb) info inferiors

# Show information about the current inferior
(gdb) inferior

# Switch to a specific inferior by ID
(gdb) inferior <infno>

# Kill inferiors
(gdb) kill inferiors <infno...>

# Detach from inferiors
(gdb) detach inferiors <infno...>

# Remove inferiors by IDs
(gdb) remove-inferiors <infno...>
To add an inferior or clone an existing one, switch to it, set command-line arguments, and run the process, follow the steps below. Note that cloning an inferior duplicates the current inferior, including its args and cwd properties.
1
2
3
4
5
6
7
8
9
10
11
12
13
14
# Add a new inferior with a specified executable
(gdb) add-inferior -exec <executable>

# Clone the current inferior
(gdb) clone-inferior <infno>

# Switch to the desired inferior
(gdb) inferior <id>

# Set command-line arguments for the current inferior
(gdb) set args <arguments>

# Run the program
(gdb) run
You can also set breakpoints specific to an inferior:
1
(gdb) break <locspec> inferior <id> if <expression>
Threads
Here is a sample C++ code to practice GDB’s multi-threaded commands. Save it to a file named
main.cppand useg++ -g -std=c++20 main.cpp -o main && gdb ./mainto compile and debug it:
1
2
3
4
5
6
7
8
9
10
11
12
13
14
15
16
17
18
19
20
21
22
23
24
25
26
27
28
29
30
31
32
33
#include <barrier>
#include <iostream>
#include <syncstream>
#include <thread>
#include <vector>

std::barrier sync_barrier(4);

void worker(std::stop_token stopToken, int id) {
  while (!stopToken.stop_requested()) {
    std::osyncstream(std::cout) << "Thread " << id << " is executing\n";
    sync_barrier.arrive_and_wait();
  }
}

int main() {
  std::vector<std::jthread> threads;
  for (int i = 0; i < 3; ++i) {
    threads.emplace_back(worker, i + 1);
  }

  std::string input;
  while (std::cin >> input) {
    sync_barrier.arrive_and_wait();
  }

  for (auto &t : threads) {
    t.request_stop();
  }

  sync_barrier.arrive_and_wait();
  return 0;
}
By default, when a breakpoint is hit, GDB stops all threads in the program. However, you can configure GDB to stop only the thread that hits the breakpoint using the following commands:
1
2
3
4
5
# Disable output pagination for uninterrupted debugging
(gdb) set pagination off

# Enable non-stop mode
(gdb) set non-stop on
This approach is particularly useful when debugging a running program that cannot be fully stopped, such as a server handling live requests.
To manage and switch between threads in an inferior, use the following commands:
1
2
3
4
5
# List all threads
(gdb) info threads

# Switch to a specific thread
(gdb) thread <id>
If you are in non-stop mode and need to stop all threads manually, use:
1
2
3
4
5
# Interrupt all threads
(gdb) interrupt -a

# Resume execution for all threads
(gdb) continue -a
From a design perspective, threads within a program should be as isolated as possible from one another. The behavior of your program should not rely on precise timing between threads, as this can lead to extremely difficult-to-debug issues. Testing this can be done by stopping one thread and allowing others to continue running while you debug specific portions of the code.
You can execute a command across multiple threads using:
1
(gdb) thread apply <thread-id-list|all> <-c|-s|-q> command
The thread-id-list can be something like 1 2-3 4.5 6.7-9 7.* which includes threads 1 to 3 of current inferior, thread 5 of inferior 4, threads 7 to 9 of inferior 6 and all threads of inferior 7. The flags modify how the command is applied:
-c: Continue threads after running the command.-s: Causes any errors or empty output to be silently ignored.-q: Disables printing the thread information.
You can use
taasas a shorthand forthread apply all -s.
This feature is particularly useful in scenarios where multiple threads are waiting behind a lock or hit a breakpoint. You can investigate local variables in each thread or print the entire stack frames for all threads simultaneously. For example:
1
2
3
4
5
# Print a specific variable for all threads
(gdb) taas print <var>

# Print stack frames for all threads
(gdb) taas bt
Stack Frames
Each function call creates its own stack frame, which is added to the top of the call stack. When a function exits, its corresponding frame is removed from the stack. To view all the stack frames accumulated so far, use the following commands:
1
2
(gdb) backtrace
(gdb) bt
You can navigate to the stack frame created by a specific function using:
1
(gdb) frame function <name>
To move up or down the stack one frame at a time, use:
1
2
(gdb) up
(gdb) down
While a frame is selected, you can further examine its details using the info command. To display general information about the currently selected frame:
1
2
(gdb) frame
(gdb) info frame
To investigate the arguments passed to the function or the local variables within the selected frame:
1
2
(gdb) info args  # Optionally filter by <name> or -t <type-name>
(gdb) info locals  # Optionally filter by <name> or -t <type-name>
The apply option for the frame command functions similarly to how it works with thread. It allows you to execute a command on multiple frames. For example, to list all variables of a specific type in the program, you can use:
1
(gdb) thread apply all -s frame apply all -s info locals -q -t <variable-type>
This will iterate through all frames and display the local variables of the specified type <type-name>.
Expressions
The print command is arguably the most important of them all. It provides you with the insight you need to debug your code. Any construct can be investigated with the correct use of this command. First, we will explore its numerous customizations in a reference-style format. Then, through examples, we’ll demonstrate how these customizations can be applied to make debugging more efficient and insightful.
Formatters
To format the output of print, you can use various modifiers to specify the representation:
1
2
3
4
5
6
7
8
9
10
11
12
13
14
15
16
17
(gdb) print /c 10
# $1 = 10 '\n'

(gdb) print /t 10
# $2 = 1010

(gdb) print /x 10
# $3 = 0xa

(gdb) print /z (long long)10
# $4 = 0x000000000000000a

(gdb) print /d 0xfffffff6
# $5 = -10

(gdb) print /u 0xfffffff6
# $6 = 4294967286
Modifiers
The way print displays the result of an expression can be customized further using various modifiers. The list below shows all available modifiers, which can be helpful in specific scenarios. You can refer to this list as needed. Each modifier also has a corresponding GDB setting. For example, to enable -pretty for all print commands by default, use set print pretty on.
1
2
3
4
5
6
7
8
9
10
11
12
13
14
15
16
17
18
19
20
21
22
23
24
25
26
27
28
29
30
31
32
# Pretty-print arrays
(gdb) print -array -- <array>

# Include array indexes in the output
(gdb) print -array-indexes -- <array>

# Limit the number of array elements displayed
(gdb) print -elements <num> -- <array>

# Suppress repeated array elements
(gdb) print -repeats <num> -- <array>

# Limit the depth of nested structures
(gdb) print -max-depth <num> -- <variable>

# Stop printing strings after a null character
(gdb) print -null-stop <on|off> -- <text>

# Print with indentation for better readability
(gdb) print -pretty <on|off> -- <text>

# Print unions
(gdb) print -union <on|off> -- <var>

# Display the actual derived type of objects
(gdb) print -object <on|off> -- <obj>

# Show virtual tables
(gdb) print -vtbl <on|off> -- <obj>

# Split bytes into 4-bit groups
(gdb) print -nibbles on -- /t <value>
Miscellaneous
To investigate an expression or its type interactively, use:
1
2
(gdb) explore value <expression>
(gdb) explore type  <expression>
GDB provides special operators for print: {} is used for casting, and @ is used to create artificial arrays.
1
2
3
4
5
6
7
8
9
10
11
12
13
14
# Interpret data at <address> as if it were of type <type>
(gdb) print {<type>} <address>
(gdb) print {double} 0xffab

# Create an artificial array starting at <first_element> with <length> elements
# of type decltype(<first_element>)
(gdb) print <first_element>@<length>
(gdb) set $ptr = &my_vector[0]
(gdb) print *$ptr@3
# $1 = {3, 2, 1}

# Display memory as a raw array with limited repeats
(gdb) print -repeats 2 -- /x *(unsigned char*)$ptr@(8*3)
# $2 = {0x3, 0x0 <repeats 7 times>, 0x2, 0x0 <repeats 7 times>, 0x1, 0x0 <repeats 7 times>}
Each use of print saves the result in value history with a format like $<id>. To access the history:
1
2
3
4
5
# Show the last ten values
(gdb) show values

# Show values around a specific history ID
(gdb) show values <num>
Examples
Most debuggers provide the ability to list elements of arrays in your program. But what if an array contains pointers to a base type, and you want to inspect each derived object it points to? GDB makes this possible by allowing you to write while loops to iterate over expressions:
1
2
3
4
5
6
7
# Initialize an index variable
(gdb) set $i = 0

# Iterate through the array
(gdb) while ($i < <array-length>)
  print -pretty -object -- /x *(array[$i++])
  end
This approach lets you dynamically inspect the content of pointer-based arrays, including dereferencing and viewing the derived objects.
Consider the following C++ code with a class hierarchy:
1
2
3
4
5
6
7
8
9
10
11
12
13
14
15
16
17
18
19
20
21
22
23
24
25
26
#include <iostream>

// Base class
class Base {
public:
    virtual ~Base() = default;
    virtual void speak() const {
        std::cout << "Base class speaking.\n";
    }
};

// Derived class
class Derived : public Base {
public:
    void speak() const override {
        std::cout << "Derived class speaking.\n";
    }
};

int main() {
    Base* basePtr = new Derived();
    basePtr->speak(); // Calls Derived's speak

    delete basePtr;
    return 0;
}
As another example, let’s use GDB to see how a class stores type information and virtual functions (V-Table).
1
2
3
4
5
(gdb) print -pretty -object -vtbl -- /x *basePtr
# $1 = (Derived) {
#   <Base> = {
#     _vptr.Base = 0xaaaaaaabfd10 <vtable for Derived+16>
#   }, <No data fields>}
Pay close attention to _vptr.Base. It points to the address of the derived V-Table in memory. Investigating that further:
1
2
3
4
5
6
7
8
9
10
11
12
13
14
15
16
17
18
19
20
21
22
23
24
25
26
27
28
29
30
31
32
(gdb) set $vtbl = 0xaaaaaaabfd10 - 16
(gdb) set $i = 0
(gdb) while($i < 16)
 >print ((void **)$vtbl)[$i++]
 >end
# $2 = (void *) 0x0
# $3 = (void *) 0xaaaaaaabfd50 <typeinfo for Derived>
# $4 = (void *) 0xaaaaaaaa0c7c <Derived::~Derived()>
# $5 = (void *) 0xaaaaaaaa0cac <Derived::~Derived()>
# $6 = (void *) 0xaaaaaaaa0bb0 <Derived::speak() const>
# $7 = (void *) 0x0
# $8 = (void *) 0xaaaaaaabfd68 <typeinfo for Base>
# $9 = (void *) 0xaaaaaaaa0c00 <Base::~Base()>
# $10 = (void *) 0xaaaaaaaa0c24 <Base::~Base()>
# $11 = (void *) 0xaaaaaaaa0b84 <Base::speak() const>
# $12 = (void *) 0xfffff7e77958 <vtable for __cxxabiv1::__si_class_type_info+16>
# $13 = (void *) 0xaaaaaaaa0d28 <typeinfo name for Derived>
# $14 = (void *) 0xaaaaaaabfd68 <typeinfo for Base>
# $15 = (void *) 0xfffff7e76ae8 <vtable for __cxxabiv1::__class_type_info+16>
# $16 = (void *) 0xaaaaaaaa0d38 <typeinfo name for Base>
# $17 = (void *) 0x1

(gdb) print -object -pretty -- *(std::type_info*)($3)
# $18 = (__cxxabiv1::__si_class_type_info) {
#   <__cxxabiv1::__class_type_info> = {
#     <std::type_info> = {
#       _vptr.type_info = 0xfffff7e77958 <vtable for __cxxabiv1::__si_class_type_info+16>,
#       __name = 0xaaaaaaaa0d28 <typeinfo name for Derived> "7Derived"
#     }, <No data fields>},
#   members of __cxxabiv1::__si_class_type_info:
#   __base_type = 0xaaaaaaabfd68 <typeinfo for Base>
# }
Displays
GDB can automatically display a set of variables and expressions every time it hits a breakpoint or steps through the code. To add an expression to the display list, use the following commands:
1
2
3
4
5
# Add an expression to be displayed
(gdb) display <expression>

# Display memory in hexadecimal
(gdb) display /10wx &var
To view the current list of expressions being displayed, simply run the display command without arguments. For managing the display list, you can use these commands:
1
2
3
4
5
6
7
8
9
# List all expressions
(gdb) info display

# Delete all expressions
(gdb) delete display

# Enable/Disable a specific display
(gdb) enable display <id>
(gdb) disable display <id>
Altering Variables
You can modify a variable’s value while debugging the program by using print with an assignment expression. Consider the following C++ code, which prints the second variable as many times as the first one.
1
2
3
4
5
6
7
8
9
10
11
12
#include <iostream>

int main() {
  int first = 0;  // Set the first variable
  std::string second = "Hello";  // Set the second variable

  while (--first > 0) {
    std::cout << first << second << std::endl;
  }

  return 0;
}
Start a GDB session and run the code until the while loop. Then, you can change the behavior of your program by altering the value of the first variable like this:
1
2
3
4
5
(gdb) print first = 3
(gdb) continue
# Continuing.
# 2Hello
# 1Hello
This changes the value of first to 3 and causes the loop to run as expected, printing the second variable (“Hello”) multiple times.
Macros
GDB includes a powerful tool specifically designed for debugging C/C++ macros. With the macro command, you can examine the expanded result of any macro with given parameters, even if the program is not running. Below is an example C++ program featuring two macros, where one macro calls another.
1
2
3
4
5
6
7
8
9
10
11
12
13
14
15
#include <iostream>
#include <string>

// Macro to add file and line information
#define FILE_LINE "[" << __FILE__ << ":" << __LINE__ << "] "

// Macro to log a message with file and line info
#define LOG_MESSAGE(msg) \
    std::cout << FILE_LINE << msg << std::endl;

int main() {
    int value = 42;
    LOG_MESSAGE("The value is " << value);
    return 0;
}
Compile your program with the necessary flags to include macro information in the debug symbols:
1
g++ -gdwarf-5 -g3 main.cpp -o main
And in a GDB session:
1
2
(gdb )macro expand LOG_MESSAGE(test)
# expands to: std::cout << "[" << "/home/mohammad/main.cpp" << ":" << 17 << "] " << test << std::endl;
Memory
Anyone who has worked with low-level code appreciates the usefulness of viewing raw memory. Sometimes, it is the only way to catch the most difficult bugs. No matter what your expectations for an algorithm are, it ultimately boils down to 0s and 1s, which are the single source of truth in your single-threaded code.
Enough introduction. The command to show raw memory is x. It has the same set of formatters as the print command, plus /i for showing instructions. After the /, you should always specify the number of memory units you want to show, followed by the unit itself, and at the end, the format.
1
2
3
4
5
6
(gdb) x /40bx <address>  # b for bytes
(gdb) x /20hx <address>  # h for half words  (4 bytes)
(gdb) x /10wx <address>  # w for words       (4 bytes)
(gdb) x /5gx  <address>  # g for giant words (8 bytes)
(gdb) x /40bt <address>  # t for base two
(gdb) x /32i  <function> # i for instructions
Continuing our example from the Expressions section, let’s see the instructions for the Derived class destructor.
1
2
3
4
5
6
7
8
9
10
11
12
13
(gdb) x /12i 0xaaaaaaaa0c7c
#    0xaaaaaaaa0c7c <_ZN7DerivedD2Ev>:    stp     x29, x30, [sp, #-32]!
#    0xaaaaaaaa0c80 <_ZN7DerivedD2Ev+4>:  mov     x29, sp
#    0xaaaaaaaa0c84 <_ZN7DerivedD2Ev+8>:  str     x0, [sp, #24]
#    0xaaaaaaaa0c88 <_ZN7DerivedD2Ev+12>: adrp    x0, 0xaaaaaaabf000
#    0xaaaaaaaa0c8c <_ZN7DerivedD2Ev+16>: add     x1, x0, #0xd10
#    0xaaaaaaaa0c90 <_ZN7DerivedD2Ev+20>: ldr     x0, [sp, #24]
#    0xaaaaaaaa0c94 <_ZN7DerivedD2Ev+24>: str     x1, [x0]
#    0xaaaaaaaa0c98 <_ZN7DerivedD2Ev+28>: ldr     x0, [sp, #24]
#    0xaaaaaaaa0c9c <_ZN7DerivedD2Ev+32>: bl      0xaaaaaaaa0c00 <_ZN4BaseD2Ev>
#    0xaaaaaaaa0ca0 <_ZN7DerivedD2Ev+36>: nop
#    0xaaaaaaaa0ca4 <_ZN7DerivedD2Ev+40>: ldp     x29, x30, [sp], #32
#    0xaaaaaaaa0ca8 <_ZN7DerivedD2Ev+44>: ret
Note the ~Derived calling the base class destructor _ZN4BaseD2Ev.
Registers
GDB keeps track of several useful registers while debugging your program. Here are some of the commonly used ones:
1
2
3
4
(gdb) p/x $pc  # For program counter
(gdb) x/i $pc  # For next instruction
(gdb) p/x $sp  # For top of the stack
(gdb) p/x $fp  # For current frame pointer
Save and Load
GDB allows you to dump a variable or a portion of memory into a binary file, which you can later load and investigate. To create, load, or inspect a dump file, follow these steps:
1
2
3
4
5
6
7
8
9
10
11
# To view the contents of the dump file
xxd -g4 dmp.bin

# To create a dump of an expression
(gdb) dump binary value dmp.bin <expression>

# To create a dump of memory between two addresses
(gdb) dump binary memory dmp.bin <from-address> <to-address>

# To restore the dump to a specific address
(gdb) restore dmp.bin binary <address>
Altering Memory
You can use the set command in GDB to modify the value of a memory at a specific address. Consider the following C++ code:
1
2
3
4
5
6
7
8
9
10
11
#include <iostream>
#include <vector>
#include <cstdint>

int main() {
  std::vector<uint8_t> data{0xff, 0x00, 0xff, 0xff};
  for (auto v : data) {
    std::cout << (int)v << std::endl;
  }
  return 0;
}
When data is in scope, you can use GDB to change the memory contents of the data vector. Here’s how to do it:
1
2
3
4
5
6
7
8
9
10
11
12
13
14
# View the contents of the vector
(gdb) print /x data
# $1 = std::vector of length 4, capacity 4 = {0xff, 0x00, 0xff, 0xff}

# View the address of the first element of the vector
(gdb) print &data[0]
# $2 = (unsigned char *) 0xaaaaaaad32b0 "\377"

# Change the second element of the vector (at index 1)
(gdb) set *((uint8_t*)(0xaaaaaaad32b0) + 1) = 0xee

# Verify the contents of the vector after the modification
(gdb) print /x data
# $3 = std::vector of length 4, capacity 4 = {0xff, 0xee, 0xff, 0xff}
The same method also applies to the instructions section of your program.
VS Code and GDB
VS Code provides excellent support for debugging C and C++ applications with GDB through the C/C++ extension by Microsoft. This extension integrates GDB into VS Code, allowing developers to set breakpoints, inspect variables, step through code, and analyze program execution within a modern, lightweight environment.
To configure GDB in VS Code, you need a launch.json file in the .vscode directory of your project. This file defines the debugger settings, including the executable path, arguments, and debugging type. A typical GDB configuration looks like this:
1
2
3
4
5
6
7
8
9
10
11
12
13
14
15
{
  "version": "0.2.0",
  "configurations": [
    {
      "name": "Launch",
      "type": "cppdbg",
      "request": "launch",
      "program": "${workspaceFolder}/your_executable",
      "cwd": "${workspaceFolder}",
      "stopAtEntry": false,
      "externalConsole": false,
      "MIMode": "gdb"
    }
  ]
}
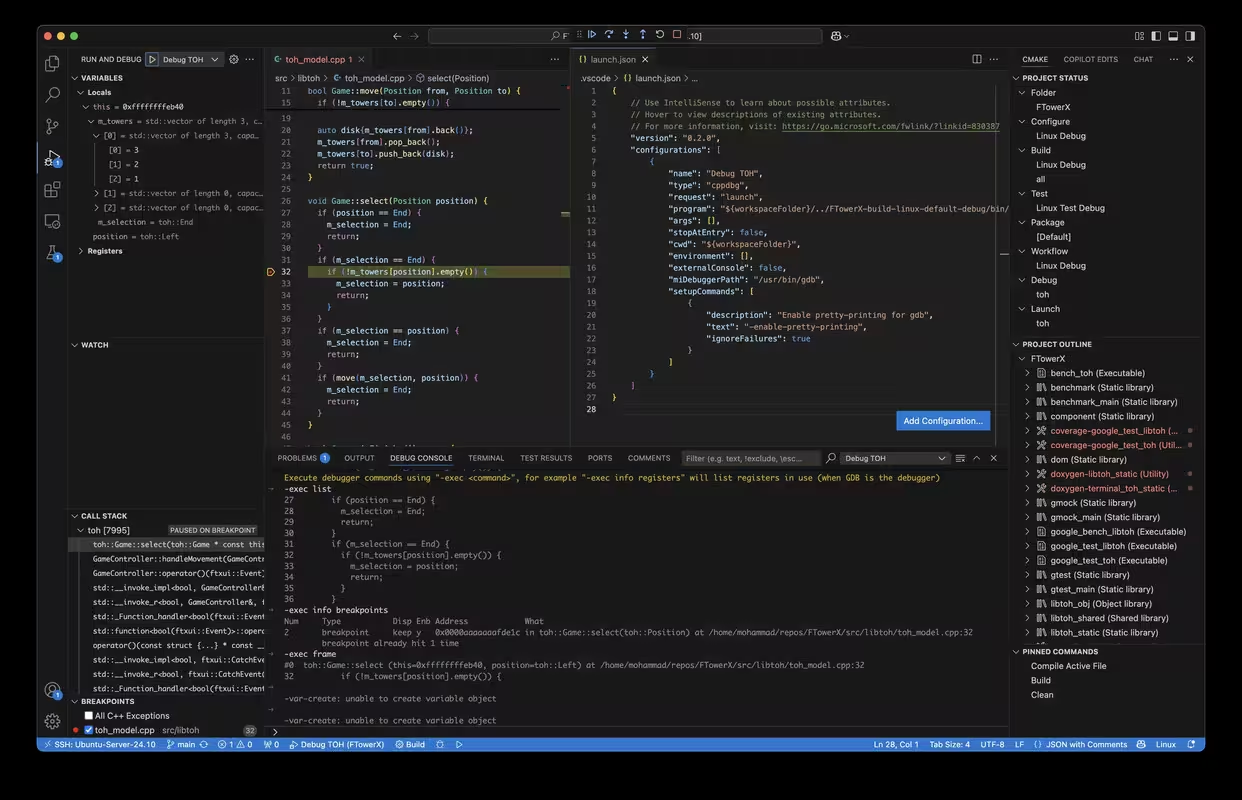
Once set up, you can start a debugging session by pressing F5 or selecting Run and Debug from the sidebar. VS Code provides an interactive debugging UI, displaying local variables, call stacks, and watch expressions. The Debug Console allows you to execute GDB commands directly and separated from your executable output, offering full control over the debugging session.
Wei Ning also recommended another useful GDB tool: GDBFrontend. GDBFrontend is a front end for GDB that provides an intuitive UI for debugging. It includes features such as pointer visualization, linked-list visualization, conditional breakpoints, connected expressions, and more.
Conclusion
Congratulations! You’ve made it! Now you are equipped with one of the most powerful debuggers, and you can use it in any environment—embedded, desktop, or on the fly on a server. I truly hope this tutorial has been useful and interesting to you. If you have any additional techniques or insights, feel free to share them in the comments below.
Happy GDBugging!